This article is part one in a two part series. Go here to read part two.
Ultrasound is most often used as a rapid anatomic screening method but is little appreciated as a semi quantitative tumor marker screening method. Here we show results demonstrating that targeted microbubbles introduced into the circulation of tumor bearing mice can be detected as localizing in the tumor. The method described here allows for the rapid and sequential detection of at least 3 microbubbles in less than 30 minutes and this time could be reduced by half. In this study the localization of untargeted microbubbles and microbubbles targeted to αVβ3 (data not shown), VEGFR, and tenascin were examined in human 786-0 renal carcinoma xenografts in Nu/Nu mice. Both αVβ3 and VEGFR are endothelial/tumor cell surface markers and tenascin is a tumor associated extracellular matrix protein. All three tumor markers localized in tumors as compared to untargeted microbubbles.
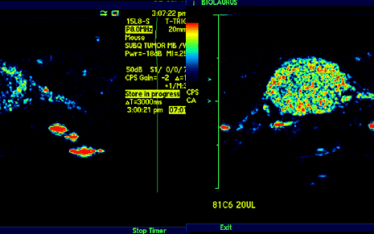
Tumor cells are implanted subcutaneously and allowed to grow to a volume of 200-400 cmm. Prior to microbubble injection and ultrasound examination mice were anesthetized with isoflurane/air and maintained anesthetized during all imaging procedures. Mice are positioned on their side and ultrasound gel applied to the tumor surface. An articulated arm holds the ultrasound transducer in place with typically a 2-3 mm offset. While a rodent specific ultrasound can be used such as the Fuji Vevo2100 we typically use a clinical Siemens Sequoia (data shown here) or Phillips Ui22 ultrasound with 12-17 MHz transducer.
Images are acquired with a 2-3 second frame rate in the following sequence; 1. B mode 1-2 frames (anatomic reference, 2. Contrast mode 1-2 frames pre microbubble injection, 3. Time zero injection of microbubbles (10-30 ul volume) and start of contrast image acquisition for 7 minutes, 4. Microbubble burst from transducer to eliminate all microbubbles in the tumor and adjacent normal tissue. Once the microbubbles are burst the sequence can be repeated with the next microbubble. The recommended sequence is to start with untargeted microbubbles followed by targeted microbubbles sequentially.
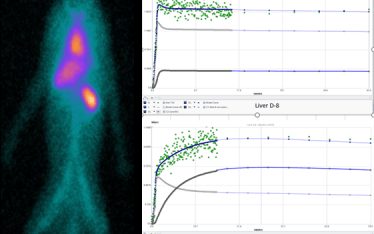
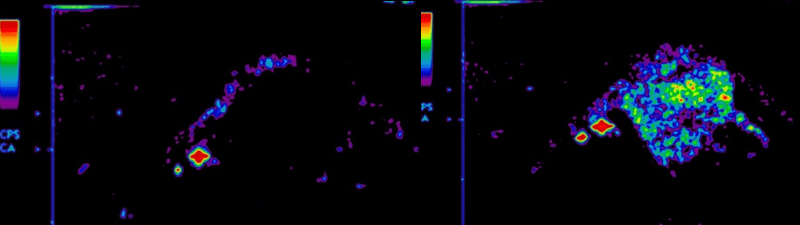
The microbubble echo intensity time activity curve (TAC) are shown below (Fig. 1-3) for a representative 786-0 tumor bearing mouse sequentially dosed with untargeted and targeted microbubbles. Representative B mode and Contrast mode images are shown for untargeted and VEGFR microbubbles at t=0 and t=7 minutes. In order to compare treatments in a tumor and as treatment groups we have calculated the ratio of tumor activity/ccm to adjacent normal tissue activity/ccm, the TNR, for each treatment 7 minutes following injection of microbubbles, data shown for n=4 mice (Fig.4).
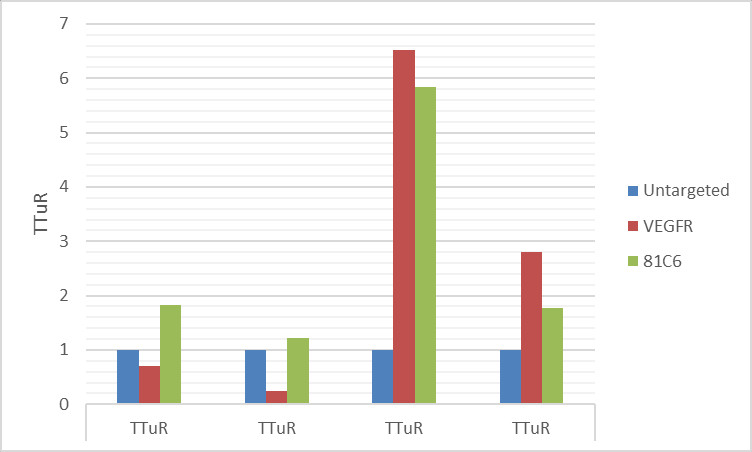
In 3 of the 4 mice the untargeted TNR is greater than 1 indicating a higher background or retention of microbubbles in the tumor vasculature compared to surrounding normal tissue. To normalize for this observation the TNR of the treatment group was compared to the TNR of untargeted microbubbles (TTuR) (Fig.5). From these results it is clear that microbubbles targeting tumor endothelial cells and tumor matrix localize to tumor xenografts in immune compromised mice. The localization heterogeneity may reflect tumor heterogeneity which in the case of VEGFR may reflect the much higher expression of VEGFR in the periphery of tumors (active angiogenesis) compared to central regions of the tumor. As observed from the TAC (fig. 1-3) the overall time to do three microbubble treatments could be shortened by half by choosing to tabulate activity/cc data from a 3.5 – 4-minute window. At this earlier time the TNR would likely be higher compared to the 7-minute window.
This article is part one in a two part series. Go here to read part two.
Figure 1 Untargeted TAC (control: yellow, tumor: green)
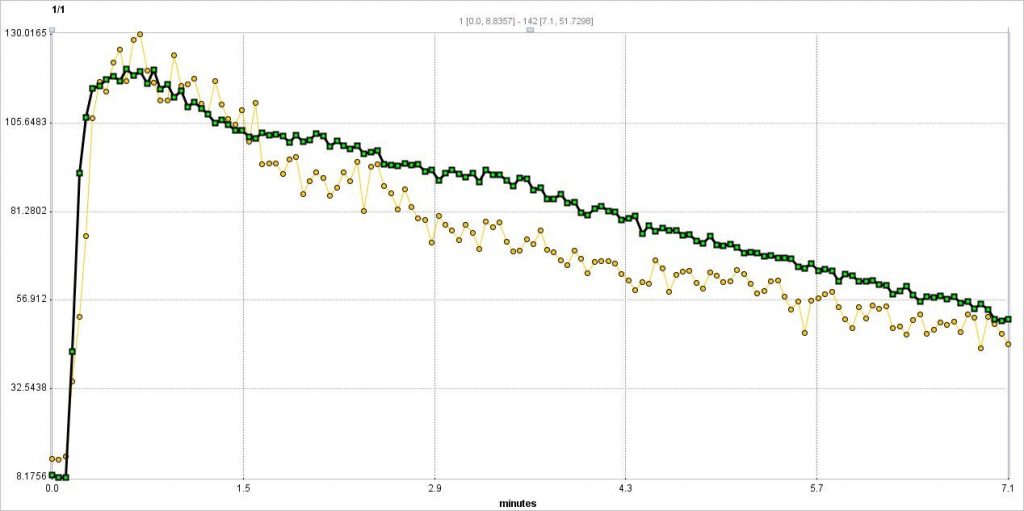
Figure 2 VEGFR targeted TAC( control: yellow, tumor: green)
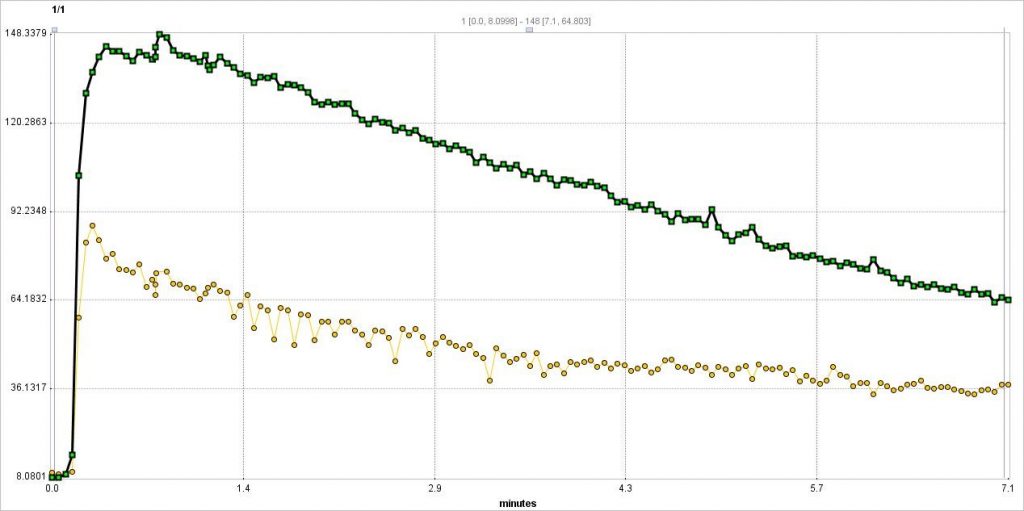
Figure 3 Tn targeted TAC (control: yellow, tumor: green)
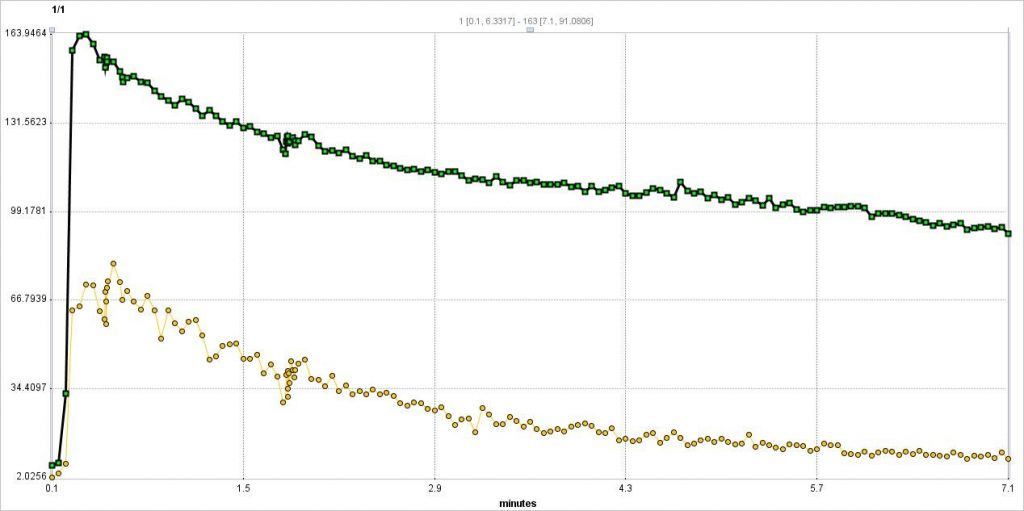
Fig. 4 TNR for n=4 mice treated with untargeted, VEGFR, or Tn microbubbles
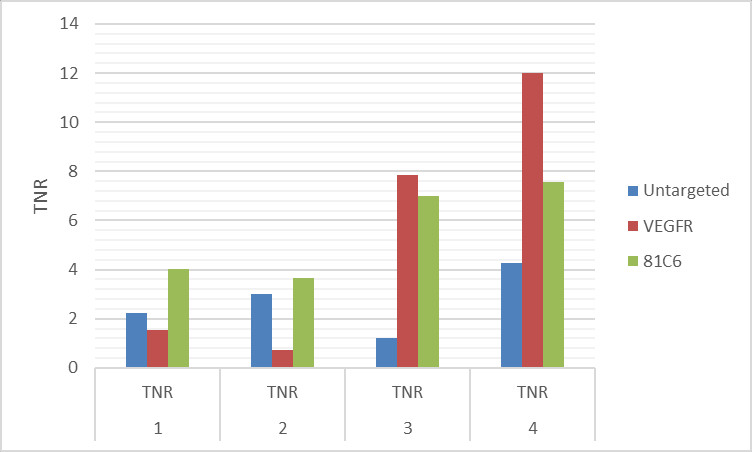
Fig. 5 TTuR for n=4 mice treated with untargeted, VEGFR, or Tn microbubbles