BioLaurus and Triangulum Bioscience have collaborated to develop an Ultrasound method to measure NASH in the CDAHFD model of liver fibrosis in mice. Age matched mice fed normal chow or CDAHFD chow for 12 weeks were examined by ultrasound. Liver fibrosis can be determined in live mice by changes in tissue echogenicity. The results confirmed by histology. In the assay control and treatment groups can be followed in longitudinal studies in live mice dramatically reducing test animal numbers (3R) and allowing tracking of therapy progression. This means studies can be shortened or lengthened based on clinical criteria and not a fixed pre-study time course.
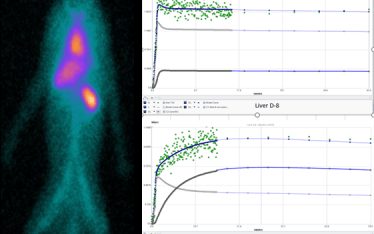
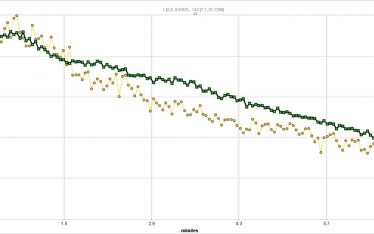
CDAHFD treated mice develop liver fibrosis over a 12-week time course. The disease progression can be tracked by ultrasound. The livers of CDAHFD mice go through the typical NASH progression from increased fat deposition (fatty liver) to end-stage liver cirrhosis. The extent of fatty liver deposit and fibrosis is measured by echo imaging mice and analyzing echo images. The echo intensity units of the liver are compared to the kidney (reference tissue) and reported as either echo intensity units or Echo Liver/kidney Ratio (ELKR). In the echo data shown here the normal mouse ELKR is 0.473 and NASH mouse ELKR averages 1.866. In the typical study mice can develop NASH over a 9 to 12-week time course followed by ultrasound echo imaging to confirm staging of the disease before initiating a therapeutic drug treatment study and one or more echo time points. Below is shown liver images of mice at 12 weeks on the CDAHFD diet. Shown are representative H&E histology and collagen histologic staining and corresponding Echo images.
Figure 1 H&E Stained liver sections from normal mouse (left panel) and age matched CDAHFD mouse (right panel)
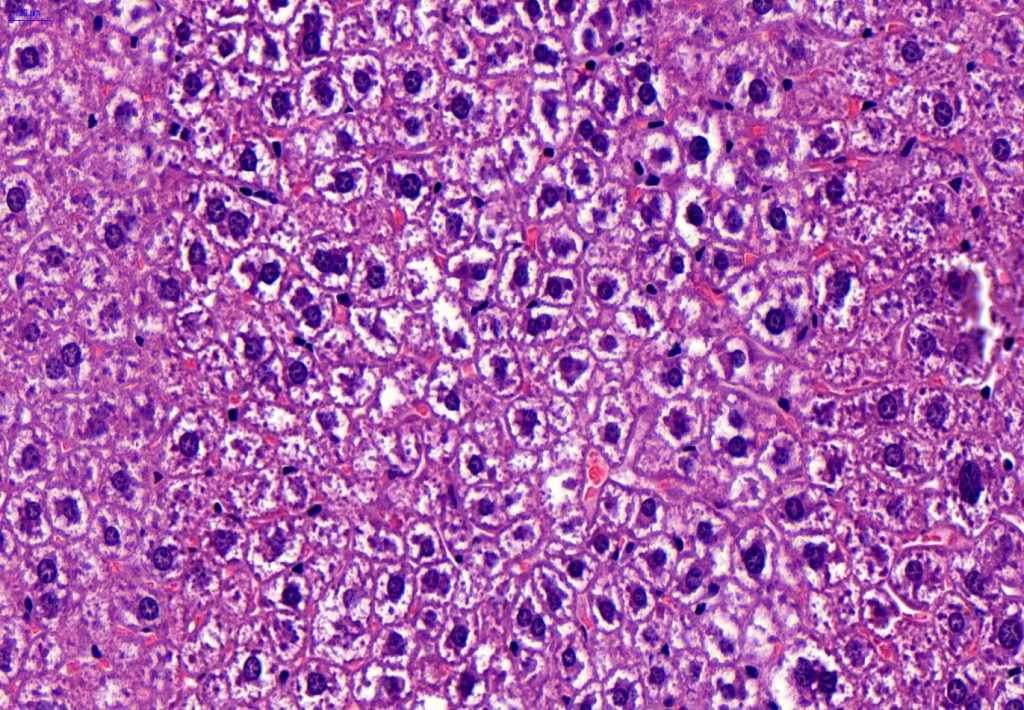
Normal Mouse Liver 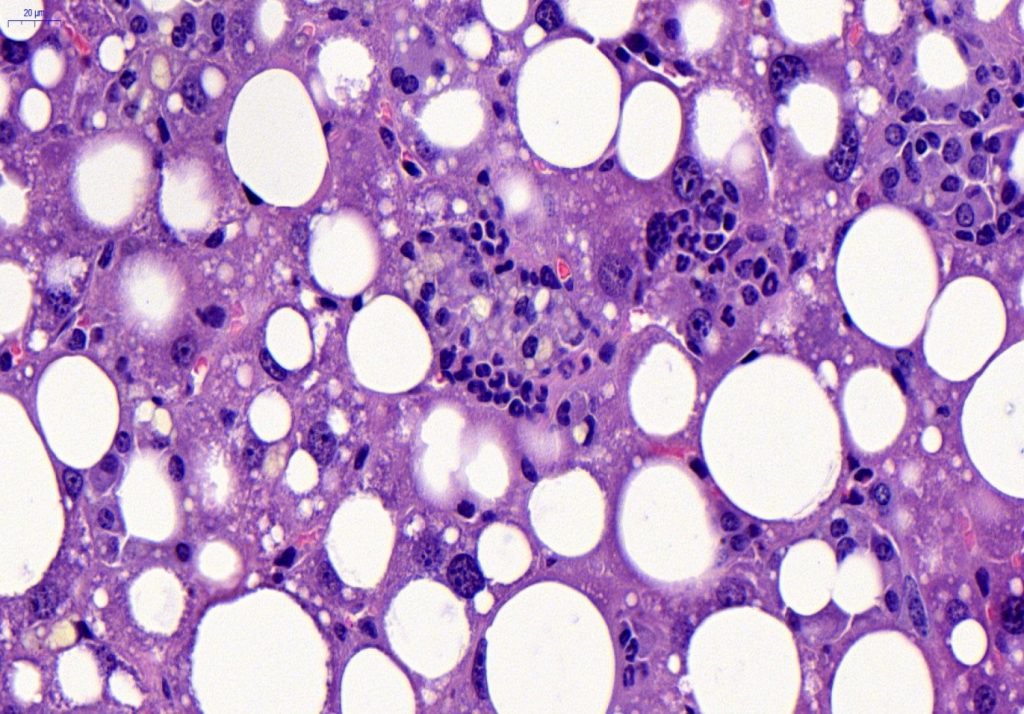
Age Matched CDAHFD
Figure 2 Collagen stain of normal mouse (left panel) and age matched CDAHFD mouse (right panel.
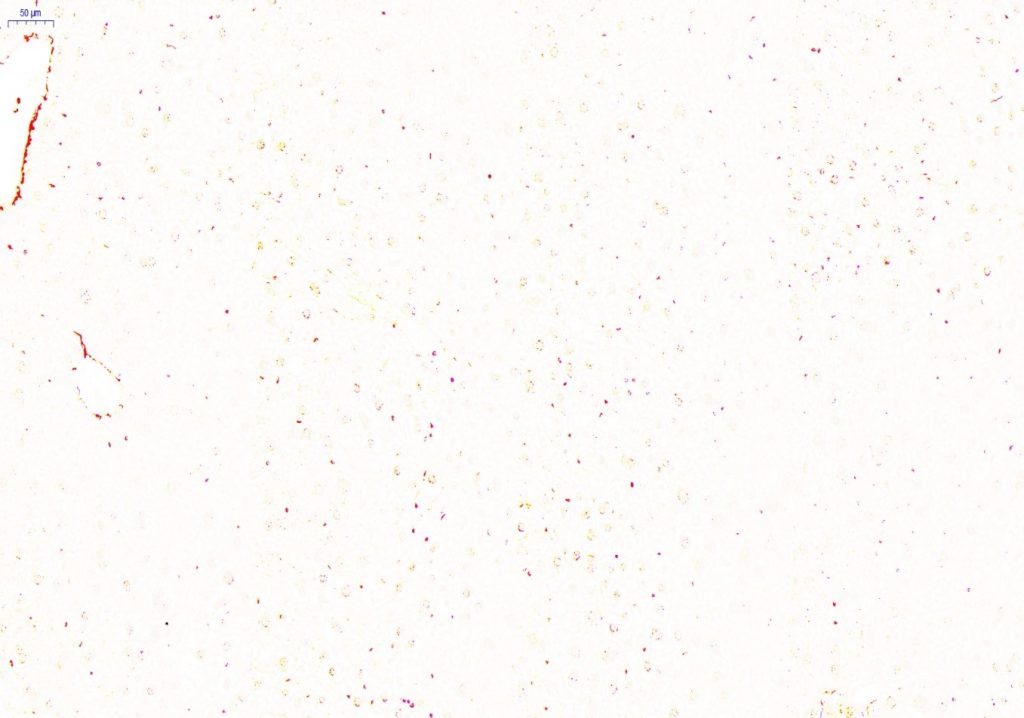
Normal Mouse Collagen 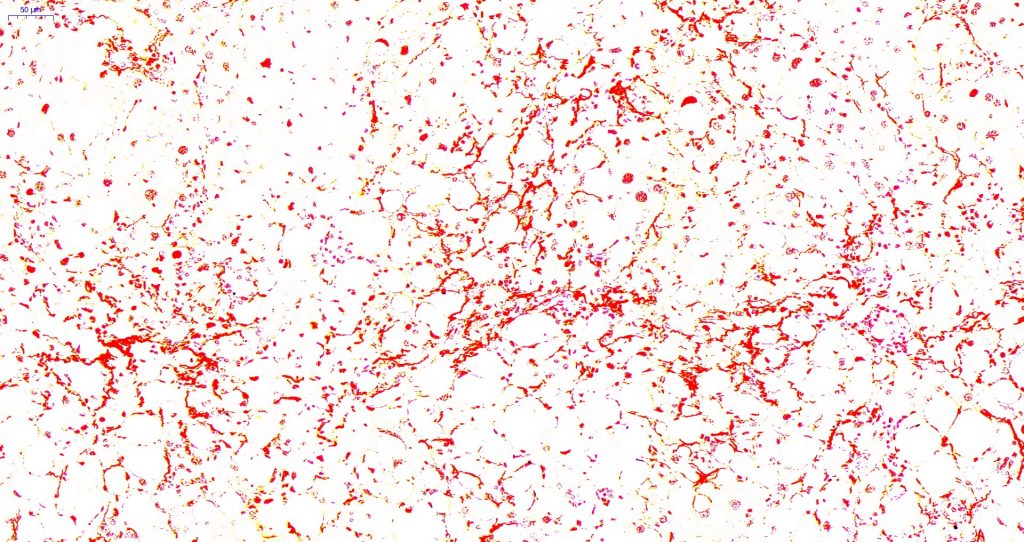
Age Matched CDAHFD
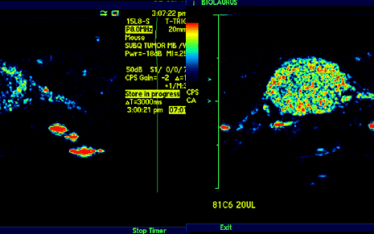
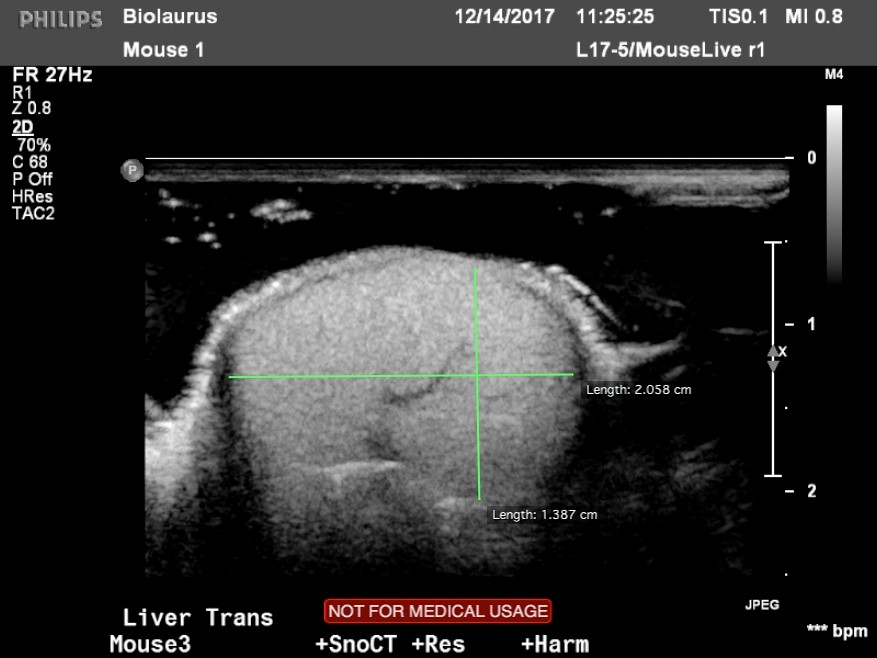
Figure 3 Ultrasound images of normal mouse liver (left panel) and CDAHFD mouse (right panel).
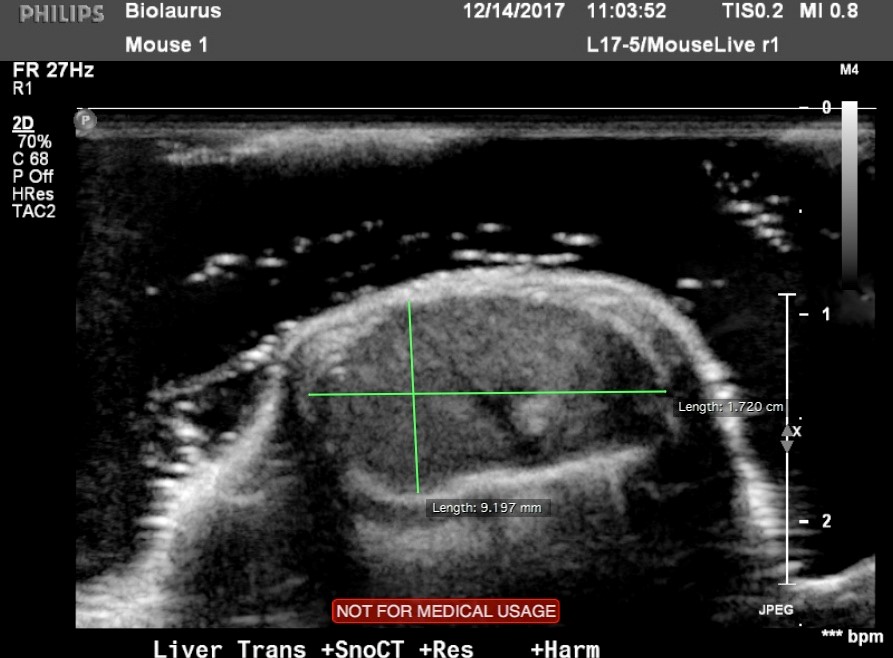
Normal Mouse Liver (Ultrasound) CDAHFD Mouse Liver (Ultrasound)