A wide range of drugs from heparin to small molecules, antisense oligonucleotides (ASO), peptides, and biologics have been found to induce thrombocytopenia. Often the mechanism of action (MOA) is an immune response with a variety of consequences including life threating thrombocytopenia and thrombosis.1–7 Understanding the MOA and underlying kinetics of drug induced thrombocytopenia is a critical part of avoiding or mitigating this patient response to a novel drug.
We have previously discussed the analysis of platelets in circulation and binding/sequestration to spleen and liver (see blog). But the currently used approach is limited to determining the changes in the concentration of labeled platelets (SUV and SUVR) in circulation and target organs. What is lacking is any insight into the kinetic process of platelet binding to target organs and how these changes as a result of drug treatment. Experimentally, a methodology is needed to determine the kinetic binding/sequestration rates of both circulating platelets (PLT) and the organ sites of binding/sequestration.
Ideal conditions for kinetic rate analysis are generally unattainable in practice and therefore particle (such as PLT) in vivo kinetic analysis is considered impossible. We propose that in fact it is possible to measure kinetic parameters of sequestration that at least are internally consistent within an experimental model.
For decades, thrombocytopenia has been measured experimentally and in the clinic by enumerating the concentration (k PLT/µl) of circulating PLT. There are severe limitations in this method; there is the inherent inability of measuring sequestration (the “were the circulating PLT go to”). To determine the levels of circulating PLT and the levels of sequestration and as important where they sequester McAfee and Thakur pioneered the SPECT/gamma camera In-111 PLT tracking methods used today.3,4,6
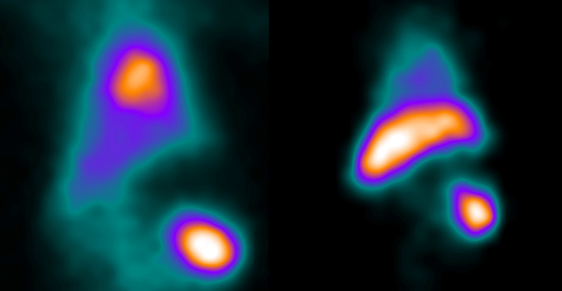
SPECT imaging allows for the in vivo tracking of labeled PLT for up to 2 weeks. However, it is only necessary to track sequestration events over a 24-hour timeframe in most cases. Obtaining SPECT tomographic (3D) data sets allows for determination of SUV and SUVR for distinct time points and organs. While these measures provide for a normalized concentration value of PLT in specific organs, they do not extend to compartment kinetic rates. Obtaining 3D data however is very challenging particularly in larger animal test subjects such as non-human primates. Data sets are usually planar images, that is 2D projections of 3D data. This means that SUVR for example are clearly internally consistent and reflect changes in relative concentration of sequestered PLT between control and test group data but are disproportionate to the organ volumes. Further corrections for organ volume is often impossible by direct measurement but reference organ weight data is available for most species including rodents, rabbits, pigs, monkeys. Using these procedures images can be obtained for PLT sequestration pre and post treatment (longitudinal study model) or by comparison of control and treated groups (see images above).
Given the challenges of obtaining static planar image, SUV and SUVR data it might seem totally impractical to do kinetic analysis. This is not the case with the caveat that the kinetic results are not presumed to be precise as those obtained with PET imaging but proportional and internally consistent.
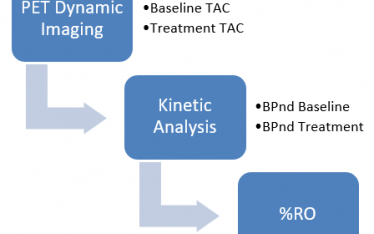
We propose the following method to obtain in vivo In-111 PLT kinetic binding/sequestration rates. We do a planar 60-minute dynamic image scan beginning with In-111 PLT injection followed by scans at one or more later time points up to 24 hours. Dynamic imaging has opened new opportunities to measure in real time and in vivo not only PLT concentrations in circulation and but also in any organ/tissue in the body. The planar image ROI for heart spleen and liver are defined and total activity in kBq for each time point obtained. The data are then converted to a time activity curve (TAC) in kBq/s/g (reference organ weight) (Fig. 2).
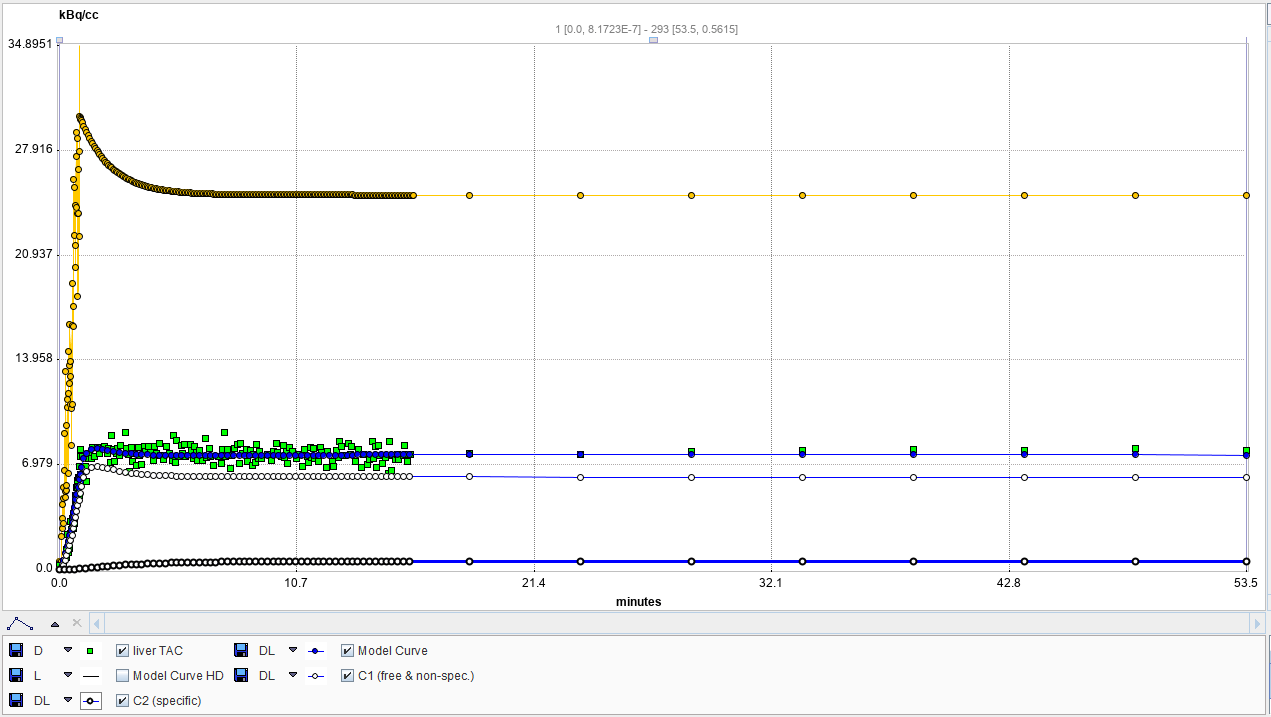
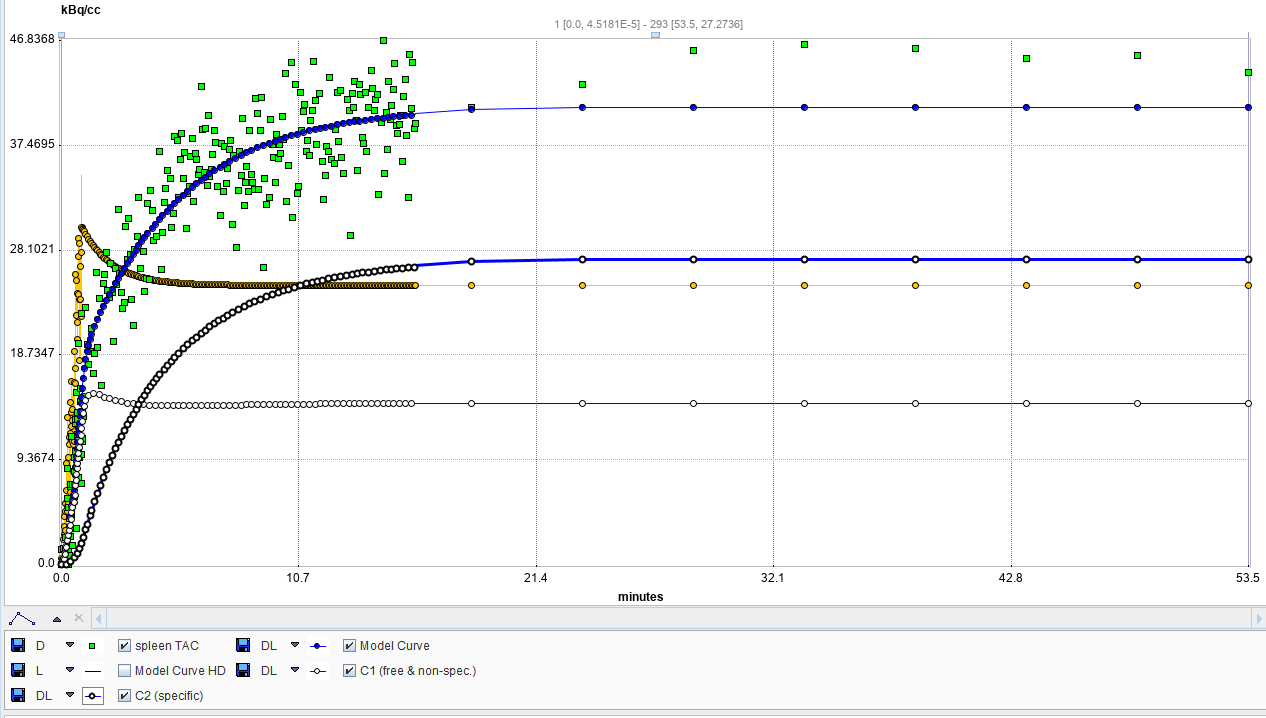
Figure 2. Representative TAC kinetic analysis (2-tissue) in Cynomolgus monkey. Liver (left) and Spleen (right). Whole blood (heart), yellow. Organ TAC, green. Specific binding bolded line, and non-specific, un-bolded line.
The TACs are analyzed in PKIN kinetics module of PMOD. The resulting single tissue and 2-tissue compartment analysis show very high fit (R2) with the 2-compatment model having a better fit.
| Region | Model | K1 | k2 | k3 | k4 | Vs | Vt | K1/k2 | k3/k4 | R2 |
| Liver | 2_Tissue_Compartments | 0.895 | 3.623 | 0.028 | 0.308 | 0.023 | 0.270 | 0.247 | 0.091 | 0.953184 |
| Spleen | 2_Tissue_Compartments | 2.973 | 5.135 | 0.475 | 0.251 | 1.095 | 1.674 | 0.579 | 1.891 | 0.930929 |
What does this mean?
- Heart can be a reference for circulating PLT. There is rapid equilibration of PLT in circulation following In-111 PLT injection that fit the model.
- Normal liver shows no evidence of sequestration and displays kinetics indistinguishable from the heart.
- Normal spleen sequesters a fraction of the input PLT over a 15–20-minute time frame with no further sequestration out to 60 minutes post injection.
From the results we conclude dynamic TAC kinetic analysis results are consistent with minimal to zero PLT binding in normal liver pre-drug treatment. In the normal spleen, there is sequestration consistent with a 2-tissue compartment model. This is consistent with first a fraction of PLT binding to the spleen MPS (mononuclear phagocytic system) and then irreversibly sequestered (phagocytized). This is consistent with the literature. The novelty is that we can derive kinetic rates particularly K1/k2 and receptor binding potential, k3/4, for test subjects. As a consequence of drug treatment liver uptake increases dramatically (Fig. 1 and Narayanan et al., 2018). It should now be possible re-examine treatment groups to evaluate receptor binding and sequestration in control and treatment groups. Lastly, the TAC indicate that analysis of sequestration kinetics can be done with a single dynamic image set and that later time points are unnecessary. This means a single PLT preparation is required and can be timed to drug treatment which can be a critical factor. 5
1. Aster, R. H. Drug-Induced Immune Thrombocytopenia. N Engl J Med 8 (2007).
3. McAfee, J. G. & Thakur, M. L. Survey of Radioactive Agents for in Vitro Labeling of Phagocytic Leukocytes. I. Soluble Agents. J. Nucl. Med. 17, 480–487 (1976).
4. Narayanan, P. et al. Investigation into the Mechanism(s) That Leads to Platelet Decreases in Cynomolgus Monkeys During Administration of ISIS 104838, a 2ʹ-MOE-Modified Antisense Oligonucleotide. Toxicol. Sci. 164, 613–626 (2018).
5. Tanaka, K. A. et al. In vivo platelet redistribution and acute transient thrombocytopenia after eptifibatide injection in baboons. Thromb. Res. 115, 79–87 (2005).
6. Wistow, B. W. et al. Labeling of Platelets with Oxine Complexes of Tc-99m and In-111. Part 1. In Vitro Studies and Survival in the Rabbit. J. Nucl. Med. 19, 483–487 (1978).
7. Visentin, G. P. & Liu, Chao Yan. 9. Drug Induced Thrombocytopenia. Hematol Oncol Clin North Am 21, 685 (2008).